Angela Duckworth gave a 90-second talk entitled Why Achievement Isn’t Normal.
She’s using the term “normal” in the sense of the normal (Gaussian) distribution, the bell curve. With normally distributed attributes, such as height, most people are near the middle and very few are far from the middle. Also, the distribution is symmetric: as many people are likely to be above the middle as below.
Achievement is not like that in many fields. The highest achievers achieve far more than average. The best programmers may be 100 times more productive than average programmers. The wealthiest people have orders of magnitude more wealth than average. Best selling authors far outsell average authors.
Angela Duckworth says achievement is not normal, it’s log-normal. The log-normal distribution is skewed to the right. It has a long tail, meaning that values far from the mean are fairly common. The idea of using a long-tailed distribution makes sense, but I don’t understand the justification for the log-normal distribution in particular given in the video. This is not to disparage the speaker. No one can give a detailed derivation of a statistical distribution in 90 seconds. I’ll give a plausibility argument below. If you’re not interested in the math, just scroll down to the graph at the bottom.
The factors that contribute to achievement are often multiplicative. That is, advantages multiply rather than add. If your first book is a success, more people will give your second book a chance. Your readership doesn’t simply add, as if each book were written by a different person. Instead, your audience compounds. Websites with more inbound links get a higher search engine rank. More people find these sites because of their ranking, and so more people link to them, and the ranking goes up. Skills like communication and organization don’t just contribute additively as they would on a report card; they are multipliers that amplify your effectiveness in other areas.
The log-normal distribution has two parameters: μ and σ. These look like the mean and standard deviation parameters, but they are not the mean and standard deviation of the log-normal. If X is a log-normal(μ , σ) random variable, then log(X) has a normal(μ, σ) distribution. The parameters μ and σ are not the mean and standard deviation of X but of log(X).
The product of two log-normal distributions is log-normal because the sum of two normal distributions is normal. So if the contributions to achievement are multiplicative, log-normal distributions will be convenient to model achievement.
I said earlier that log-normal distributions are skewed. I’ve got something of a circular argument if I start with the assumption that the factors that contribute to achievement are skewed and then conclude that achievement is skewed. But log-normal distributions have varying degrees of skewness. When σ is small, the distribution is approximately normal. So you could start with individual factors that have a nearly normal distribution, modeled by a log-normal distribution. Then you can show that as you multiply these together, you get a distribution more skewed than it’s inputs.
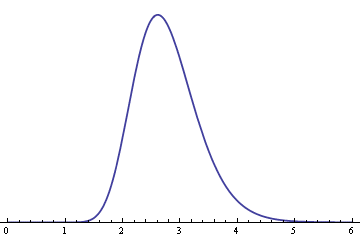
Suppose you have n random variables that have a log-normal(1, σ) distribution. Their product will have a log-normal(n, √n σ) distribution. As n increases, the distribution of the product becomes more skewed. Here is an example. The following graph shows the density of a log-normal(1, 0.2) distribution.
Here is the distribution of the product of nine independent copies of the above distribution, a log-normal(9, 0.6) distribution.
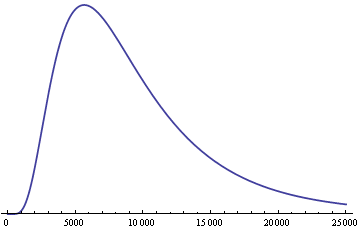
So even though the original distribution is symmetric and concentrated near the middle, the product of nine independent copies has a long tail to the right.
Related posts
- Small advantages show up in the extremes
- Variation in male and female Olympic performance: Part 1, Part 2
- Evaluate people at their best or at their worst?