Sometimes code is easier to understand than prose. Here I presented a Python script that illustrates the difference between an unbiased estimator and a consistent estimator.
Here are a couple ways to estimate the variance of a sample. The maximum likelihood estimate (MLE) is
where x with a bar on top is the average of the x‘s. The unbiased estimate is
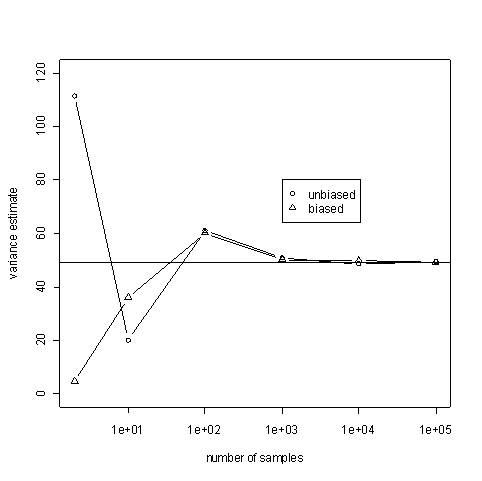
Our code will generate samples from a normal distribution with mean 3 and variance 49. Both of the estimators above are consistent in the sense that as n, the number of samples, gets large, the estimated values get close to 49 with high probability. This is illustrated in the following graph. The horizontal line is at the expected value, 49.

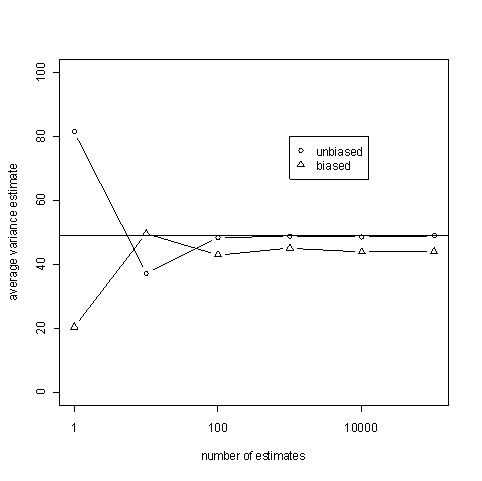
The code below takes samples of size n=10 and estimates the variance both ways. It does this N times and average the estimates. If an estimator is unbiased, these averages should be close to 49 for large values of N. Think of N going to infinity while n is small and fixed. Note that the sample size is not increasing: each estimate is based on only 10 samples. However, we are averaging a lot of such estimates.

The average of the unbiased estimates is good. But how good are the individual estimates?
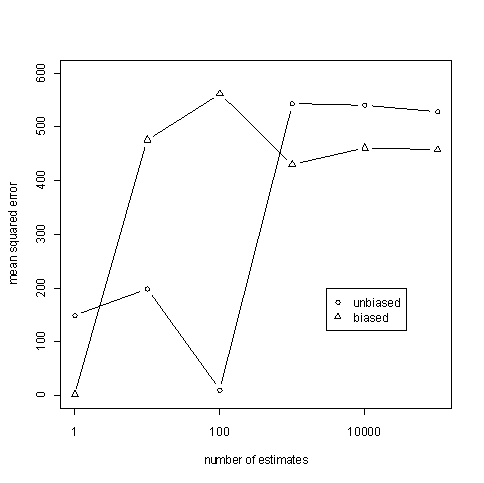
Just because the value of the estimates averages to the correct value, that does not mean that individual estimates are good. It is possible for an unbiased estimator to give a sequence ridiculous estimates that nevertheless converge on average to an accurate value. (For an example, see this article.) So we also look at the efficiency, how the variance estimates bounce around 49, measured by mean squared error (MSE).

The MSE for the unbiased estimator appears to be around 528 and the MSE for the biased estimator appears to be around 457. In this particular example, the MSEs can be calculated analytically. The MSE for the unbiased estimator is 533.55 and the MSE for the biased estimator is 456.19.
import random

mu = 3
sigma = 7

random.seed(1)

def mean(sample):
    sum = 0.0
    for x in sample:
        sum += x
    return sum/len(sample)

def square(x):
    return x*x

def sum_sq_diff(sample):
    avg = mean(sample)
    sum = 0.0
    for x in sample:
        sum += square(x - avg)
    return sum

def average_estimate(samples_per_estimate, num_estimates, biased):
    average = 0.0
    for i in xrange(num_estimates):
        sample = [random.normalvariate(mu, sigma) for j in xrange(samples_per_estimate)]
        estimate = sum_sq_diff(sample)
        if biased:
            estimate /= samples_per_estimate
        else:
            estimate /= samples_per_estimate - 1
        average += estimate
    average /= num_estimates
    return average

def mean_squared_error(samples_per_estimate, num_estimates, biased):
    average = 0.0
    for i in xrange(num_estimates):
        sample = [random.normalvariate(mu, sigma) for j in xrange(samples_per_estimate)]
        estimate = sum_sq_diff(sample)
        if biased:
            estimate /= samples_per_estimate
        else:
            estimate /= samples_per_estimate - 1
        average += square( estimate - sigma*sigma )
    average /= num_estimates
    return average

# Show consistency
sample_sizes = [2, 10, 100, 1000, 10000, 100000]
for size in sample_sizes:
    print "variance estimate biased:   %f, sample size: %d" % \
        (average_estimate(size, 1, True), size)

print

for size in sample_sizes:
    print "variance estimate unbiased: %f, sample size: %d" % \
        (average_estimate(size, 1, False), size)

print

# Show bias
num_estimates_to_average = [1, 10, 100, 1000, 10000, 100000]
fixed_sample_size = 10
for estimates in num_estimates_to_average:
    print "average biased estimate: %f, num estimates: %d" % \
        (average_estimate(fixed_sample_size, estimates, True), estimates)

print

for estimates in num_estimates_to_average:
    print "average unbiased estimate: %f, num estimates: %d" % \
        (average_estimate(fixed_sample_size, estimates, False), estimates)

print

# Show efficiency
for estimates in num_estimates_to_average:
    print "MSE biased:   %f, sample size: %d" %
        (mean_squared_error(fixed_sample_size, estimates, True), size)

print

for estimates in num_estimates_to_average:
    print "MSE unbiased: %f, sample size: %d" %
        (mean_squared_error(fixed_sample_size, estimates, False), size)

print
