I realized recently that I’ve written about generalized Gibbs phenomenon, but I haven’t written about its original context of Fourier series. This post will rectify that.
The image below comes from a previous post illustrating Gibbs phenomenon for a Chebyshev approximation to a step function.
Although Gibbs phenomena comes up in many different kinds of approximation, it was first observed in Fourier series, and not by Gibbs [1]. This post will concentrate on Fourier series, and will give an example to correct some wrong conclusions one might draw about Gibbs phenomenon from the most commonly given examples.
The uniform limit of continuous function is continuous, and so the Fourier series of a function cannot converge uniformly where the function is discontinuous. But what does the Fourier series do near a discontinuity?
It’s easier to say what the Fourier series does exactly at a discontinuity. If a function is piecewise continuous, then the Fourier series at a jump discontinuity converges to the average of the limits from the left and from the right at that point.
What the Fourier series does on either side of the discontinuity is more interesting. You can see high-frequency oscillations on either side. The series will overshoot on the high side of the jump and undershoot on the low side of the jump.
The amount of overshoot and undershoot is proportional to the size of the gap, about 9% of the gap. The exact proportion, in the limit, is given by the Wilbraham-Gibbs constant
Gibbs phenomenon is usually demonstrated with examples that have a single discontinuity at the end of their period, such as a square wave or a saw tooth wave. But Gibbs phenomenon occurs at every discontinuity, wherever located, no matter how many there are.
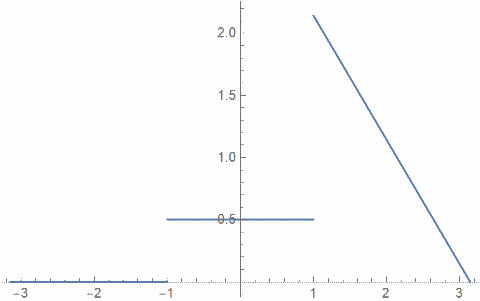
The following example illustrates everything we’ve talked about above. We start with the function f plotted below on [-π, π] and imagine it extended periodically.

Notice three things about f:
- It is continuous at the point where it repeats since it equals 0 at −π and π.
- It has two discontinuities inside [−π, π].
- One of the discontinuities is larger than the other.
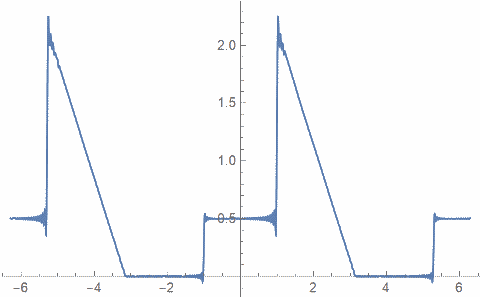
The following plot shows the sum of the first 100 terms in the Fourier series for f plotted over [−2π, 2π].

Notice three things about this plot that correspond to the three observations about the function we started with:
- There nothing remarkable about the series at -π and π.
- You can see Gibbs phenomenon at the discontinuities of f.
- The overshoot and undershoot are larger at the larger discontinuity.
Related to the first point above, note that the derivative of f is discontinuous at the period boundary. A discontinuity in the derivative does not cause Gibbs phenomena.
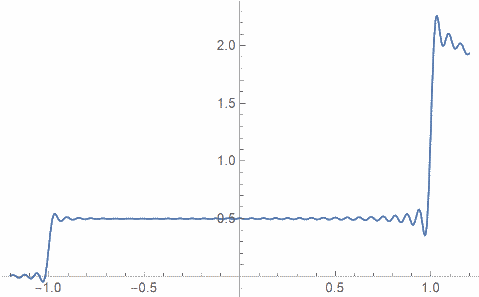
Here’s a close-up plot that shows the wiggling near the discontinuities.

Gibbs phenomena for other series
[1] Henry Wilbraham first described what Josiah Gibbs discovered independently 50 years later, what we now call Gibbs phenomenon. This is an example of Stigler’s law of eponymy.

My favorite name for this is ‘ringing’, which I hear more often in signal processing and electronics contexts. Of course, unlike a bell, this ringing also happens before you strike it, not just after.