A logarithmic scale is very useful when you need to plot data over an extremely wide range. However, sometimes even a logarithmic scale may not reduce the visual range enough.
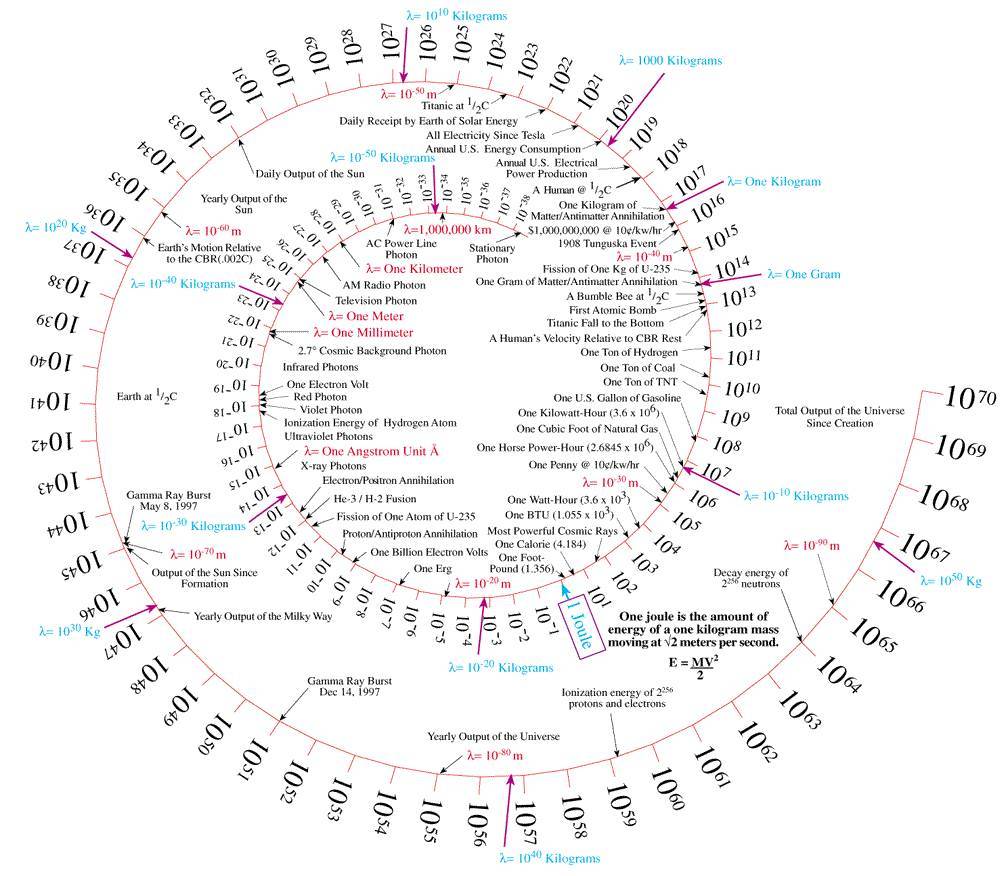
I recently saw a timeline-like graph that was coiled into a spiral, packing more information into a limited visual window [1].

I got to thinking about when this could be useful. This raises two questions.
- When might you want to visualize something that grows faster than exponentially?
- How would this compare to the radial growth of a spiral as a function of arc length?
Let’s address the second question first. What exactly do we mean by spiral? Archemedian spirals are a class of spirals that include what many people think of as a spiral. These spirals have polar equation
r = b θ1/n
where n is a constant. The choice n = 1 corresponds to spirals with evenly spaced arms, such as a roll of carpet.
When n = 1, the length of the spiral for θ running from 0 to T is T on the order of T² when T is large, as shown in this post. For general n, the length is on the order of T1 + 1/n.
If n = 1 and the distance of a spiral from the origin grows linearly as a function of θ, the arc length is growing quadratically. If the logarithm is growing quadratically, the function itself must be something like exp(kθ²).
So now back to the first question. What is something that grows super exponentially that we might want to plot? The first thing that came to my mind was factorials. Stirling’s approximation shows that the logarithm of factorial grows faster than linearly but slower than any power with exponent larger than 1.
log(x!) = x log x − x + O(log x).
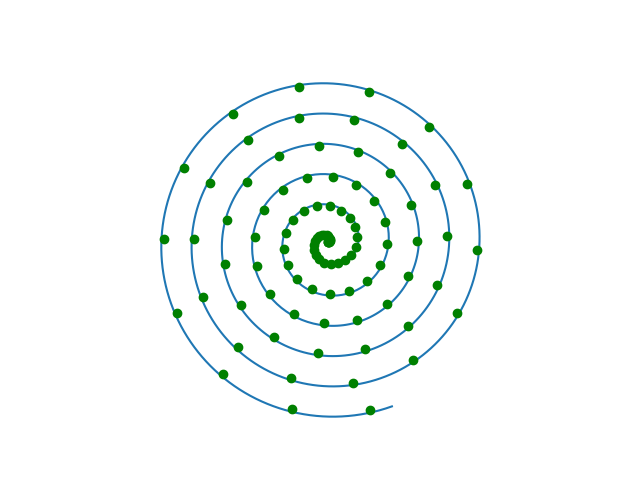
and so if we plot x! on a coiled logarithmic scale, the distance from the image of a point to the origin will grow less than linearly, even if we allow the spiral parameter n to be larger than 1. But for a limited range of x, a coiled logarithmic plot works well. Here’s a polar plot of log(x!)/10.

I don’t know of a natural example of something that grows like exp(kθ²). Of course you could always construct something to have this growth, but I can’t think of a common algorithm, for example, whose run time is the exponential of a quadratic. If you know a good example, please a comment.
[1] I can trace the provenance of the image to here, but that page doesn’t say where the image came from.

[1] Please see https://theiff.org/exhibits/iff-e1.html listing Fall 2002 and https://ora.ox.ac.uk/objects/uuid:ef82a0c5-c709-452e-8a24-a7a5ac915a69/files/me95dffedaa82e230124bd26c64114446 with later date.
Source of the image: https://web.archive.org/web/20240617105347/http://living-universe.com/wp-content/uploads/2017/05/1-Joules-of-the-Universe.pdf
Well, one thing that grows roughly like that is the expected waiting time for rare gaussian events.
That’s a good one.