
A permutation rearranges the elements of a list. The number of arrangements, say of a deck of cards, is finite, so eventually you have to arrive at an arrangement you’ve produced before, and history will repeat itself. Along the way, some cards may move in smaller cycles than others.
Example
For example, consider the permutation
p = [5, 6, 2, 1, 0, 8, 3, 4, 9, 7]
that sends i to p(i). Here indices start with 0.
The number 2 is a fixed point: p(2) = 2. So it has a cycle length of 1.
The number 1 is part of a cycle of length 3: p(1) = 6, p(6) = 3, and p(3) = 1.
The longest cycle is [0, 5, 8, 9, 7, 4] which has length 6.
Longest cycles
What happens to the length of cycles as you permute longer lists? Obviously the longest possible cycle increases with the length of the list, but what happens to the average length of the longest cycle?
Let Ln be the length of the longest cycle in a random permutation of n items. You’d expect the average value of Ln, written E[Ln], would increase when n increases. But do they increase at the same rate? Conceivably E[Ln] goes to infinity as n goes to infinity, but at a slower rate, say proportional to √n rather than proportional to n. Let’s make a plot to see.
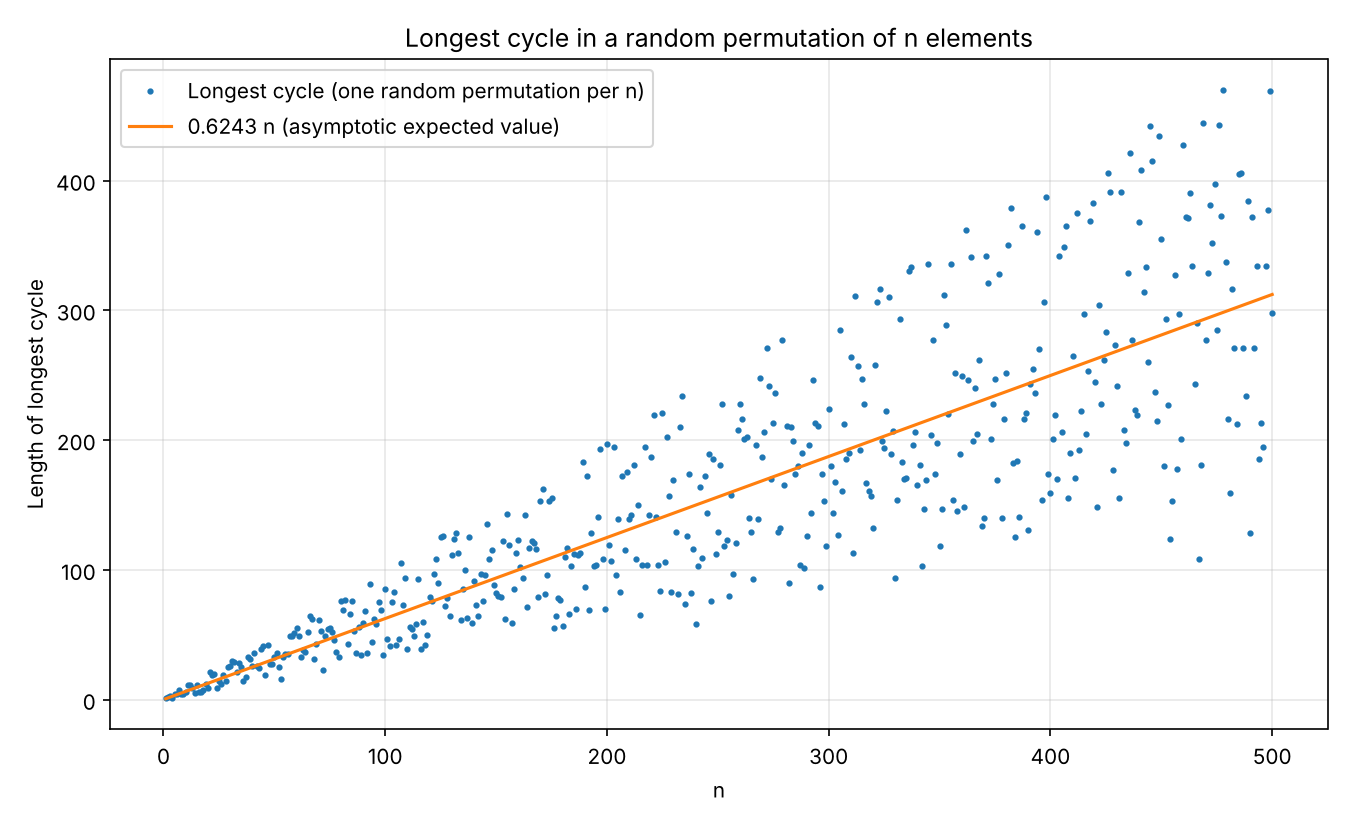
There’s a lot of variance, but the central tendency looks approximately linear in n. Let’s repeat our experiment, this time creating 100 random permutations of each size and averaging their maximum cycle lengths.
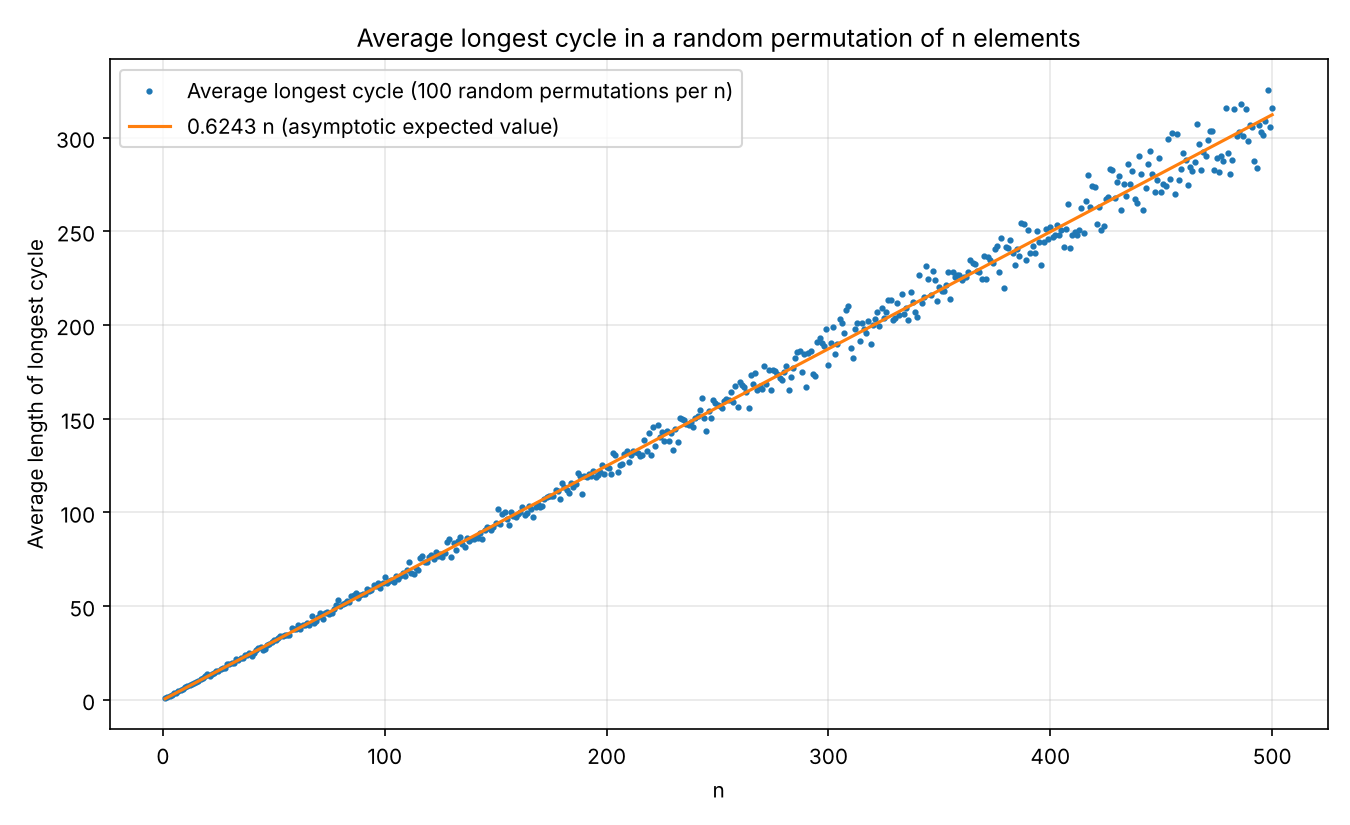
As we’d expect from the central limit theorem, averaging over 100 samples reduced the scatter by about a factor of 10.
It appears that the expected value of the maximum cycle length grows in proportion to n, and in fact the expected value is somewhere around 0.6n. In the example at the top of the post, the longest cycle is exactly 0.6n. I didn’t plan that: the permutation example was chosen at random.
Asymptotic value
The limit of the ratio E[Ln]/n is known to be

Shepp and Lloyd [1] proved the result above. The constant on the right hand side is known as the Golomb-Dickman constant. I think Golomb investigated E[Ln]/n and had found that there was a limiting value, but Shepp and Lloyd were the first to give a closed-form expression for the limit. Dickman had run into the same constant in a theorem in number theory.
[1] L. A. Shepp and S. P. Lloyd, “Ordered Cycle Lengths in a Random Permutation,” Transactions of the American Mathematical Society, vol. 121, no. 2, pp. 340–357, February 1966.
While linear is the asymptote, the line is not exactly linear – as can be obviously seen from small values of n and that the expected value for any n must be rational. I ran ten million results for n = 100 and n = 1000 and (estimated) 95% confidence intervals for the ratio were [0.627339, 0.627578] and [0.624547, 0.624786]. The asymptotic value is clearly outside the former and just outside the latter, which might not be significant. Repeating the latter with a new random number seed got the interval [0.624522, 0.62476] again just outside, which is together looking significant. So the precise figure only really matters above about n = 1000 – the O(n) behaviour though is relevant almost immediately. [Are you working towards the famous hundred prisoners problem?]