The previous post presented an approximation
for −1 ≤ x ≤ 1 and said that it was related to a probability function. This post will make the connect explicit.
Let X be a normally distributed random variable with mean μ and variance σ². Then the CDF of X is
So if μ = 0 and σ² = 1/2 then we have the following.
Here’s Python code to show how good the approximation is.
    from numpy import sin, linspace, sqrt, pi
    from scipy.stats import norm
    import matplotlib.pyplot as plt

    x = linspace(-1, 1, 200)
    X = norm(0, sqrt(0.5))
    plt.plot(x, X.cdf(x) - X.cdf(0))
    plt.plot(x, sin(sin(x))/sqrt(pi))
    plt.legend(["exact", "approx"])
    plt.xlabel("$x$")
    plt.ylabel(r"$P(X \leq x)$")
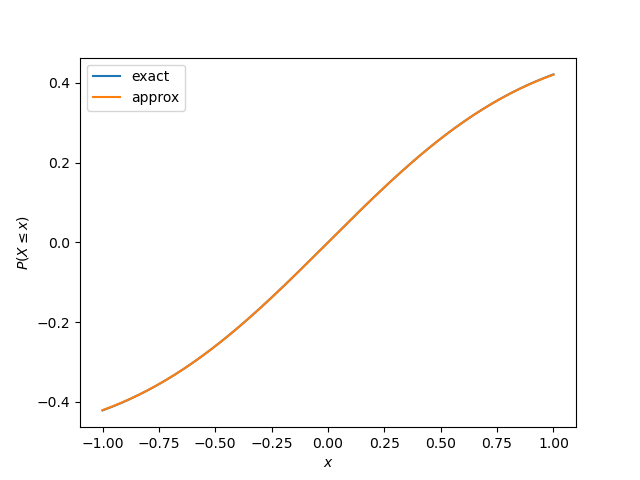
Here’s the resulting plot:

The orange curve for the plot of the approximation completely covers the blue curve of the exact value. The two curves are the same to within the resolution of the plot. See the previous post for a detailed error analysis.
