My favorite quote from Richard Feynman is his remark that “nearly everything is really interesting if you go into it deeply enough.” This post will look at something that seems utterly trivial—looking up numbers in a table—and show that there’s much more to it when you dig a little deeper.
More than just looking up numbers
Before calculators were common, function values would be looked up in a table. For example, here is a piece of a table of logarithms from Abramowitz and Stegun, affectionately known as A&S.
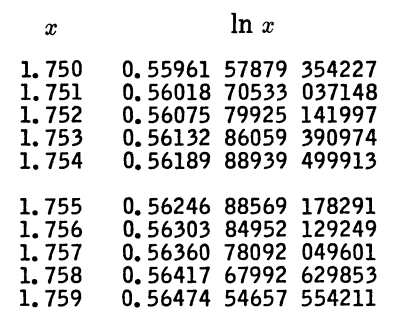
But you wouldn’t just “look up” logarithm values. If you needed to know the value of a logarithm at a point where it is explicitly tabulated, then yes, you’d simply look it up. If you wanted to know the log of 1.754, then there it is in the table. But what if, for example, you wanted to know the log of 1.7543?
Notice that function values are given to 15 significant figures but input values are only given to four significant figures. If you wanted 15 sig figs in your output, presumably you’d want to specify your input to 15 sig figs as well. Or maybe you only needed 10 figures of precision, in which case you could ignore the rightmost column of decimal places in the table, but you still can’t directly specify input values to 10 figures.
Lagrange interpolation
If you go to the bottom of the column of A&S in the image above, you see this:
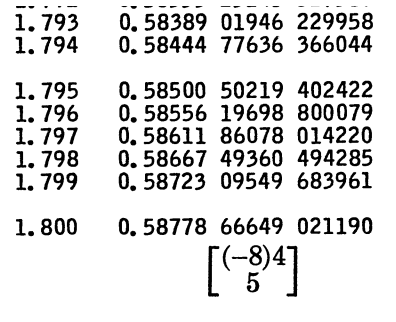
What’s the meaning of the mysterious square bracket expression? It’s telling you that for the input values in the range of this column, i.e. between 1.750 and 1.800, the error using linear interpolation will be less than 4 × 10⁻⁸, and that if you want full precision, i.e. 15 sig figs, then you’ll need to use Lagrange interpolation with 5 points.
So going back to the example of wanting to know the value of log(1,7543), we could calculate it using
0.7 × log(1.754) + 0.3 × log(1.755)
and expect the error to be less than 4 × 10⁻⁸.
We can confirm this with a little Python code.
>>> from math import log
>>> exact = log(1.7543)
>>> approx = 0.7*log(1.754) + 0.3*log(1.755)
>>> exact - approx
3.411265947494968e-08
Python uses double precision arithmetic, which is accurate to between 15 and 16 figures—more on that here—and so the function calls above are essentially the same as the tabulated values.
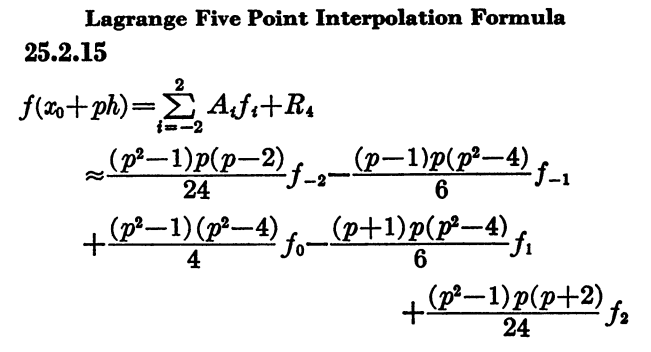
Now suppose we want the value of x = 1.75430123456789. The hint in square brackets says we should use Lagrange interpolation at five points, centered at the nearest tabulated value to x. That is, we’ll use the values of log at 1.752, 1.753, 1.754, 1.755, and 1.756 to compute the value of log(x).
Here’s the Lagrange interpolation formula, given in A&S as equation 25.2.15.
We illustrate this with the following Python code.
def interpolate(fs, p, h):
    s = (p**2 - 1)*p*(p-2)*fs[0]/24
    s -= (p - 1)*p*(p**2 - 4)*fs[1]/6
    s += (p**2 - 1)*(p**2 - 4)*fs[2]/4
    s -= (p + 1)*p*(p**2 - 4)*fs[3]/6
    s += (p**2 - 1)*p*(p + 2)*fs[4]/24
    return s

xs = np.linspace(1.752, 1.756, 5)
fs = np.log(xs)
h = 0.001
x = 1.75430123456789
p = (x - 1.754)/h

print(interpolate(fs, p, h))
print(np.log(x))
This prints
0.5620706206909348
0.5620706206909349
confirming that the interpolated value is indeed accurate to 15 figures.
Lagrange interpolation takes a lot of work to carry out by hand, and so sometimes you might use other techniques, such as transforming your calculation into one for which a Taylor series approximation converges quickly. In any case, sophisticated use of numerical tables was not simply a matter of looking things up.
Contemporary applications
A book of numerical tables enables you to do calculations without a computer. More than that, understanding how to do calculations without a computer helps you program calculations with a computer. Computers have to evaluate functions somehow, and one way is interpolating tabulated values.
For example, you could think of a digital image as a numerical table, the values of some ideal analog image sampled at discrete points. The screenshots above are interpolated: the HTML specifies the width to be less than that of the original screenshots,. You’re not seeing the original image; you’re seeing a new image that your computer has created for you using interpolation.
Interpolation is a kind of compression. A&S would be 100 billion times larger if it tabulated functions at 15 figure inputs. Instead, it tabulated functions for 4 figure inputs and gives you a recipe (Lagrange interpolation) for evaluating the functions at 15 figure inputs if you desire. This is a very common pattern. An SVG image, for example, does not tell you pixel values, but gives you equations for calculating pixel values at whatever scale is needed.
John:
Your Feynman quote (which I’d heard as “No problem is too small or too trivial if we really do something about it”) reminds me of the saying in statistics that God is in every leaf of every tree, as briefly discussed here: https://statmodeling.stat.columbia.edu/2005/10/06/god_is_in_every/