It’s a curious and convenient fact that many decibel values are close to integers [1]:
- 3 dB ≈ 2
- 6 dB ≈ 4
- 7 dB ≈ 5
- 9 dB ≈ 8
Is base 10 unique in this regard? If we were to look at the analogs of decibels in other bases, would we see a higher or lower proportion of near integers? For example, we could look at the base 12 (duodecimal) analog of decibels, or “duodecibels” for short. Or we could look at the base 16 analog “hexadecibels.”
A decibel is a multiplicative factor of 101/10 and so n decibels is a factor of 10n/10. We will denote the analog of n decibels in base b by
g(n, b) = bn/b.
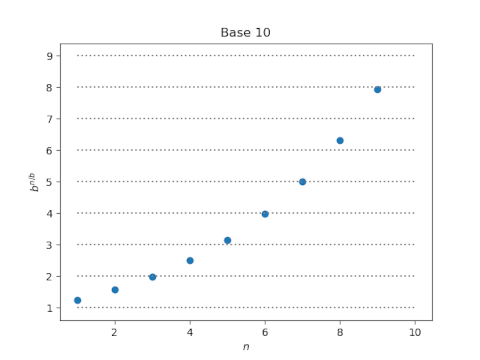
Let’s compare how many values of g(n, b) are near integers for b = 10 and 12. Here’s base 10:
And here’s base 12:
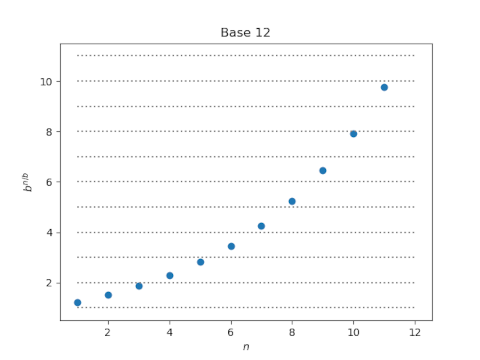
In the plot for base 10, four of the dots straddle a horizontal line, but in the plot for base 12 only two dots do. So by one standard, we could say decibels have four near integer values but duodecibels have only 2.
This comparison is informative, but it’s arbitrary because it depends on our plotting parameters. It would be better to count how many values come within ε of an integer, though that would still be somewhat arbitrary because it would depend on a choice of ε. A more objective measure would be to compute the average distance of each value of g(n, b) to the nearest integer [2].
Here’s a plot of the mean distance from generalized decibel values to the nearest integer as a function of the base b.
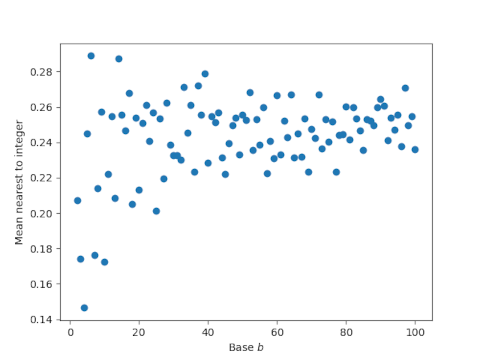
As the base gets larger, the dots seem to vary around 0.25. This is what we’d expect if the fractional parts were randomly distributed.
Let’s zoom in on bases 2 through 16:
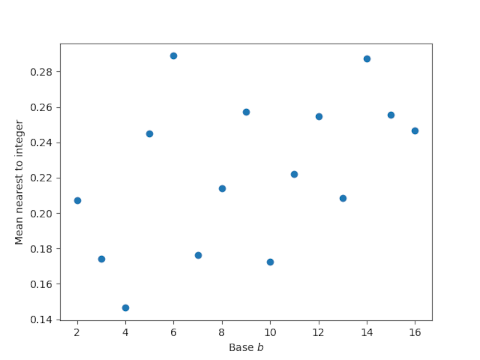
The smallest value corresponds to base 4. The second smallest value corresponds to base 10, though this is not easy to see in the plot because the values for bases 3 and 7 are only slightly higher.
So is base 10 special? It is in this sense: it has the smallest mean distance from generalized decibel values to integers for any integer base b with b > 4.
The statement above assumes that the average distance continues to hover around 0.25 for large bases, which appears to be the case. For bases 100 through 10,000 the average distances range between 0.2275 and 0.2646, well above the value of 0.1726 for base 10.
Incidentally, if we go back to counting near integers and choose ε between 0.02 and 0.17, then base 10 has the largest proportion of near integer decibel values.
Update
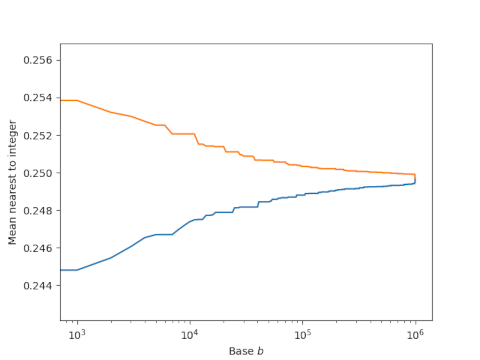
I only looked at mean distances to integers for bases up to 10,000 because I was working in Python and going further than that would be slow. I rewrote by program in C [3] and looked at bases up to 1,000,000. The two curves below give lower and upper bounds on the variation in mean distances. At each point b, the upper curve is the maximum from b to the 1,000,000 and the lower curve is the corresponding minimum. (This might remind you of lim sup and lim inf.) Note that the scale on the horizontal axis is logarithmic.
Related posts
[1] It’s also convenient that the values that are not close to integers are close fractions involving small powers of 2 and 5. More on that here.
[2] This is borrowing an idea from compressive sensing and other areas, using the L1 norm as a proxy for sparsity. It’s awkward to count how many entries in a vector are “near zero” but easier to look at the L1 norm.
[3] There are ways to make Python code run faster, but my personal rule is to not spend much time optimizing Python. I’ll try a few things, but then if that doesn’t work I rewrite things in C. Especially if it’s a small amount of code, rewriting in C is easier and more reliable, at least for me. YMMV.
