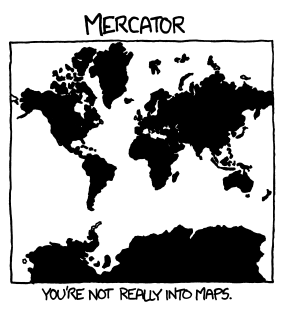
This morning’s xkcd cartoon is “What your favorite map projection says about you.” It’s really funny, but poor Mercator comes off as the most boring projection.
Mercator is the most familiar projection, but it has some interesting properties. The most important is that lines of constant bearing on the Earth correspond to straight lines on the map, obviously a desirable property for navigation. More details here.
The inverse of the Mercator projection, going from maps onto the globe, is more interesting. Aside from its geographical importance, it gives a way of relating circular and hyperbolic functions without using complex numbers. More details here.
The Mercator projection is also historically interesting. The modern derivation of the Mercator projection uses logarithms and calculus, but Mercator came up with his projection in 1569 before logarithms or calculus had been discovered. (Update: See more historical detail in Thony C’s comment below.)


Perhaps somebody should start a twitter a day for different map projections ;-)
Interestingly when Mercator published his map using his projection he did not explain the maths behind it making it impossible for others to copy his projection. The first to explain how to mathematically create a Mercator projection was the English mathematicus Edward Wright (1561 – 1615) in his book Certaine Errors in Navigation published in 1599. The necessary maths had been worked out before but not published by both John Dee (1527 – 1608) and Thomas Harriot (1560 – 1621). Wright, Dee and Harriot were all friends as were Dee and Mercator. Because he was the first to publish the maths the projection is correctly called the Mercator-Wright projection.
Thony C: Thanks for the rich historical detail!
I miss the Riemann sphere projection.