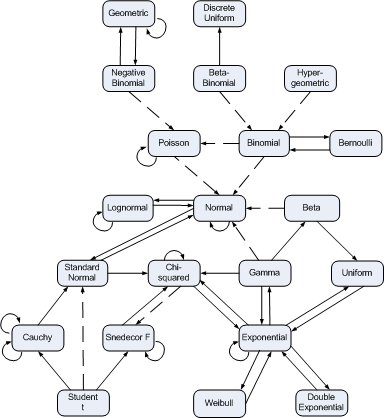
In 1986, Lawrence Leemis published a diagram illustrating the relationships between a couple dozen probability distributions. In 2008, he published a much larger diagram, available online.
I’ve created a diagram similar to the original Leemis diagram with 21 of the most common distributions. You can click on a distribution name to find out its parameterization, and you can click on an arrow to get the details of the relationship it represents. Here’s a small version of the diagram.
See Clickable chart of distribution relationships for the full diagram.

