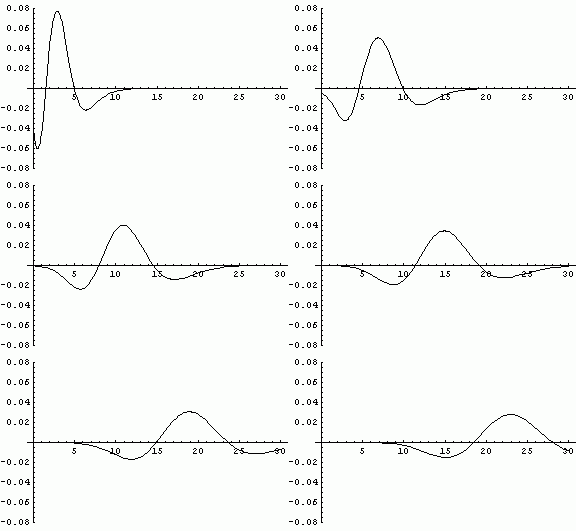
Many well-known probability distributions converge to the normal distribution as some parameter or other increases. In a sense this is not very interesting: All roads lead to Rome. But though destinations are the same, the paths to the destination are varied and more interesting.
I’ve posted notes on how the error in the normal approximation varies for the beta, gamma, and Student t distributions.
The animation below shows the error in the normal approximation to the gamma distribution as the shape parameter grows from 3 to 23. See the gamma notes for more details.

(If the image above is not animated in your browser, visit the gamma notes page where the image should display correctly in all browsers.)
